
View Student Reports in Digital Oral Reading Records Reports
If you're looking for a particular section of View Student Reports in Digital Oral Reading Records Reports, use the links below to quickly move to that section:
Student Reading Level Progress
Student Reading History Overview
Student Reading Level Progress
View an individual student’s Reading Level Progress report by selecting the Reading Level Progress tab on the Reports page. The chart displays every record a student has taken. The bubbles represent the reading level of the record and the color of the bubble shows the student’s Proficiency score.
By default, the first student (in alphabetical order) of your first class in the lowest grade is displayed. If you select the Reports button from the Student Overview, that student will be displayed in the Reports.
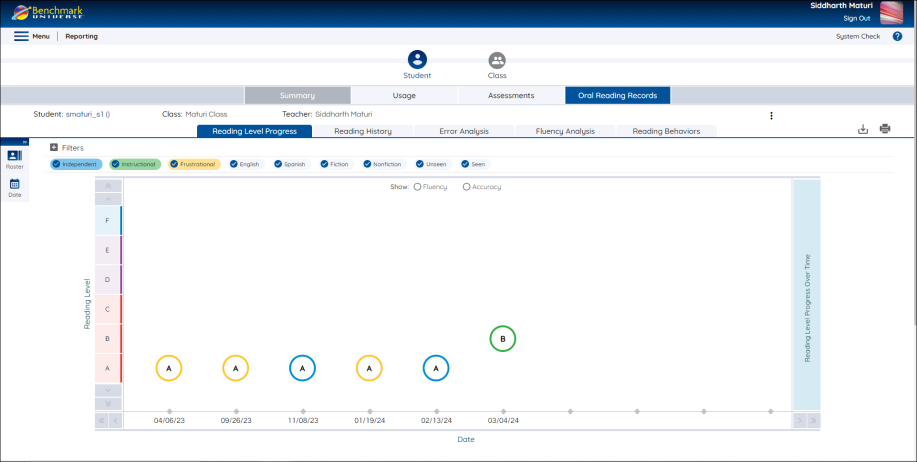
Select Oral Reading Records on the Report Type Selector tab. Ensure Student is selected at the top. Then select the Reading Level Progress tab.
- The rows on the Y Axis correspond to Reading Level.
- The points on the X Axis correspond to the dates that assignments were completed.
- A bubble’s location on the Y axis shows what Reading Level the text was. The bubble corresponds to the date the assignment was taken on the X axis.
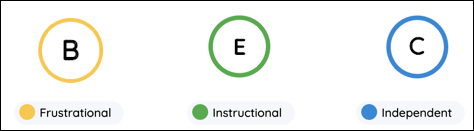
- The color of a bubble indicates the student’s Proficiency score on that assignment:
- Select a bubble to view the details for that assignment in a pop-up, which includes:
- Reading Level
- Assignment Title
- Category (Fiction/Nonfiction)
- Proficiency Level
- Accuracy
- Fluency (words correct per minute)
- Use the blue navigation arrows on the corners of the chart to see assignments in other Reading Levels or taken on other dates. The single arrow will move the chart over or up or down by one row or column at a time. The double arrow will skip all the way to the first or last row or column.
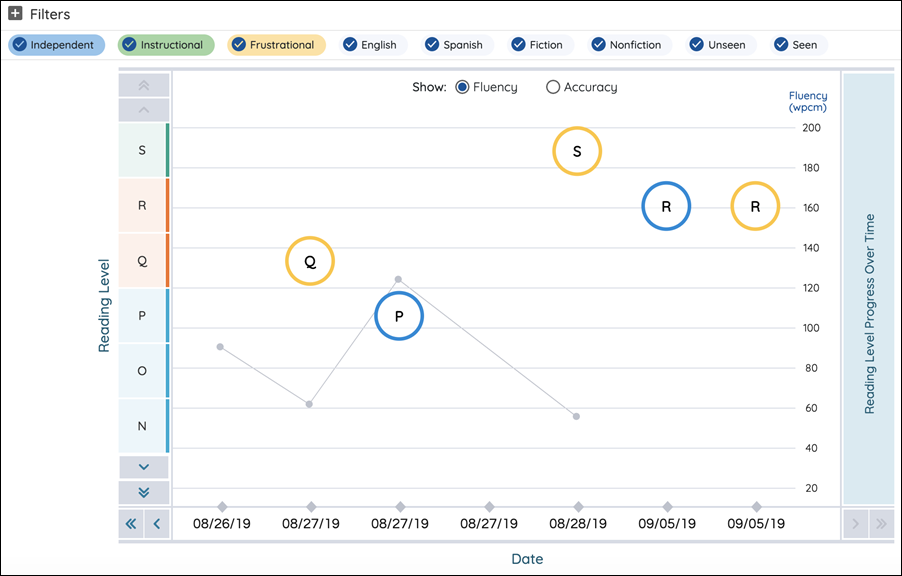
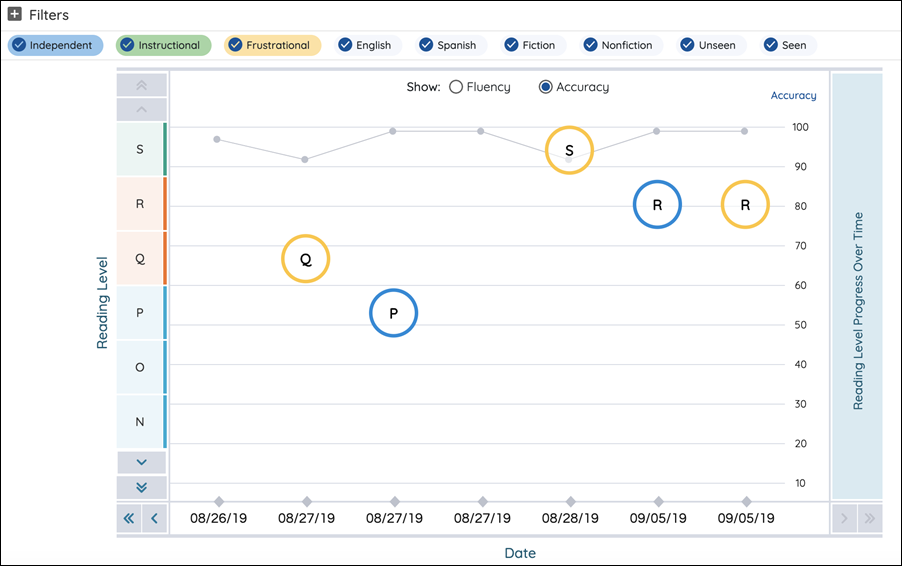
- Select the Fluency or Accuracy buttons to show a line detailing student’s Fluency or Accuracy performance across all their assignments. Each point on the line will show the student’s Fluency (if available) or Accuracy score on that assignment. If you didn’t time your student’s fluency, there won’t be a point for that record, but every record will have an accuracy.
- Use the References page to view the Oral Reading Records fluency norms for both Spanish and English.
Fluency
Accuracy
Student Reading History Overview
View a summary of all of a students’ Digital Oral Reading. Each row represents a single record. By default, the list is sorted with the most recent records at the top. Use the arrows at the top of the columns to sort the list by other categories.
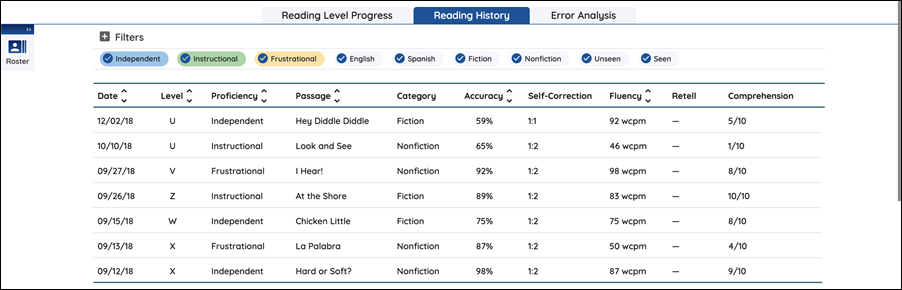
Each row contains the following information:
- Date
- Reading Level
- Proficiency Performance (Frustrational, Instructional or Independent)
- Passage Title
- Category (Fiction/Nonfiction)
- Accuracy
- Self-Correction Rate
- Fluency (words correct per minute)
- Retell score
- Comprehension score
Student Error Analysis
View an individual student’s Error Analysis report by selecting the Error Analysis tab on the Reports page. The table on the left shows how many of each type of Reading Behavior a student has made across all their assignments. The pie chart on the right shows a visual representation of the number of each type of errors.
Select Oral Reading Records on the Report Type Selector tab. Make sure Student is selected at the top. Then select the Error Analysis tab.
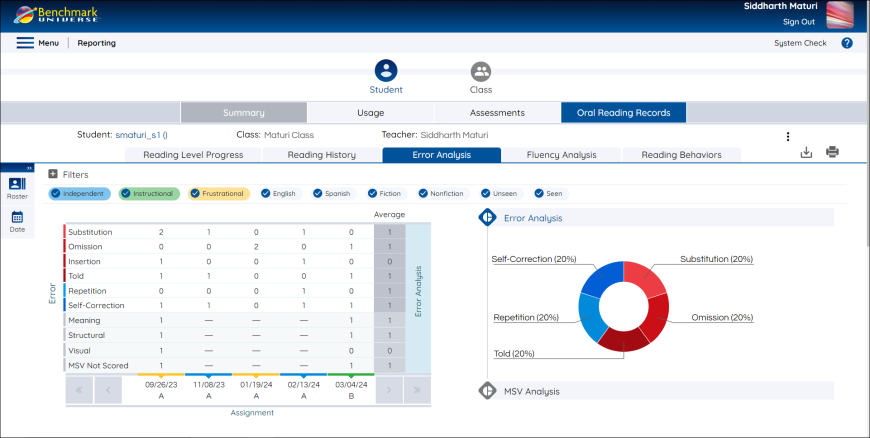
Reading Behavior table:
- The Y Axis lists all of the possible Reading Behaviors a student can make on an assignment, as well as the percentage breakdown of any MSV sources of information that were marked by the teacher. If no MSV sources were marked in that assignment, those cells will be marked with “—“.
- The X Axis lists the date each Assignment was taken and the Reading Level of the text. Hovering over the Date and Reading Level brings up the name of the Passage Title in a tooltip.
- Each cell contains the number of errors or reading behaviors the student made of each type on each assignment.
- For more information about the Reading Behaviors or MSV, see Marking an Oral Reading Record Passage.
- The Averages from this school term are displayed in the right-most column.
- Use the blue navigation arrows on the bottom corners of the Error Analysis table to view data for assignments taken other dates. The single arrow will show you other assignments by changing the columns one at a time. The double arrow will skip all the way to the first or last column. The most recent assignments will be shown by default.
Error Analysis and MSV Pie Graphs:
The pie graph on the right represents the average percent distribution of different Reading Behaviors and MSV sources across all records the student has completed. The title of each error or MSV is labeled with its average percentage in parentheses. The Error Analysis Pie Chart will be displayed by default.
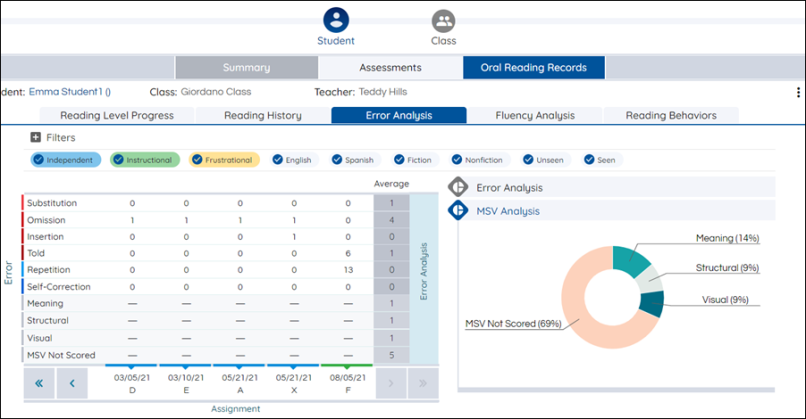
- You can switch between the two Pie Chart by selecting the pie chart headers, “Error Analysis” or “MSV Analysis”.
- Selecting an Error row or an MSV row in the Error Analysis table will open the respective Pie chart.
Fluency Analysis
This report displays a summary of a student’s Fluency and Accuracy across their Oral Reading Records. Fluency includes Phrasing, Pace, Intonation and Accuracy. A student’s comprehension of the text and how language is organized in text is demonstrated by fluency. Student scores will help you identify fluent reading behaviors and the level of student fluency throughout the year.
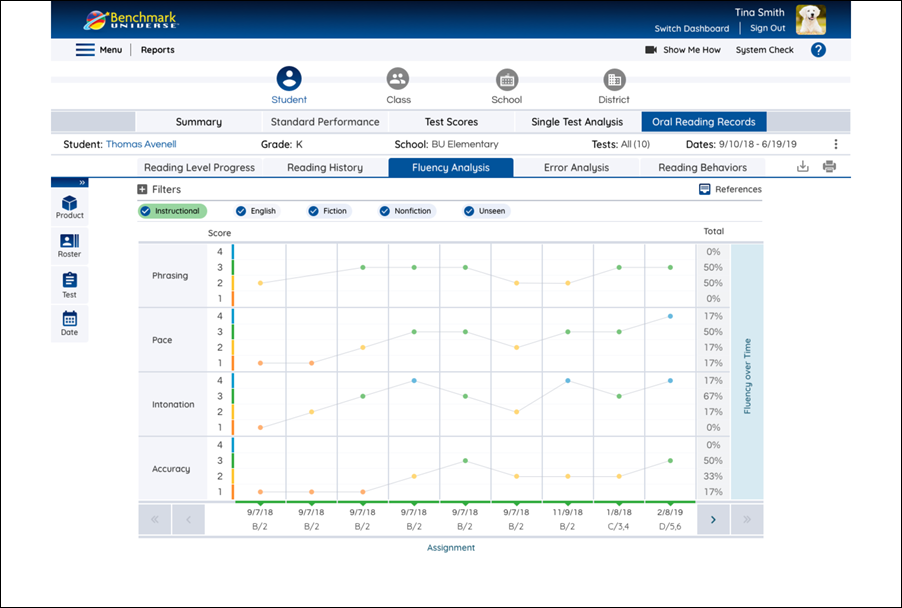
View a student’s Fluency Analysis report by selecting the Fluency Analysis tab. The points on this graph display a student’s scores according to the evaluations given on the rubrics on the Analysis section of an Oral Reading Record.

|
Since Fluency is an optional step when conducting an Oral Reading Record, there may not be a report to display. If there is no rubric data for any students, you will see a message that says “No Fluency Analysis Tracked”. Try marking some Fluency and Accuracy categories on the Analysis step when marking an Oral Reading Record. (see Analyze a Student’s Record) |
- Each point shows student’s fluency levels for a particular record. Select a point to see the full description of the student’s fluency level.
- The rows on the Y axis correspond to student performance in four Fluency and Accuracy categories:
- Phrasing
- Pace
- Intonation
- Accuracy
- Each category contains four performance levels, 1, 2, 3 and 4. Hovering over any of the levels will show you full description of that performance level.
- The columns on the X axis show the different records a student has taken from oldest to most recent. The following is displayed for each record:
- Date the record was taken
- The Reading Level of the record
- The Proficiency score the student achieved as displayed by the color (Independent - blue, Instructional - green, or Frustrational - yellow).
- Hovering over each record displays the record’s name.
- Since Analysis is an optional step for an Oral Reading Record, there may not be a point for some records. If there is no point displayed, that means the teacher did not evaluate the student on that category.
- Use the blue navigation arrows on the bottom corners of the Fluency Analysis report to view data for assignments taken on other dates. The single arrow will show you other assignments by changing the columns one at a time. The double arrow will skip all the way to the first or last column.
Fluency Analysis report is the teacher’s subjective overview of a student’s fluency according to your rubric evaluations. For an objective calculation of a students’ Fluency according to their Words Correct Per Minute across their Oral Reading Records, select the Fluency button on the Student Reading Level Progress report above.
Reading Behaviors
This report displays a summary of a student’s Reading Behaviors on their Oral Reading Records throughout the year. It helps you understand the reading techniques your student is using or neglecting while trying to read a text.
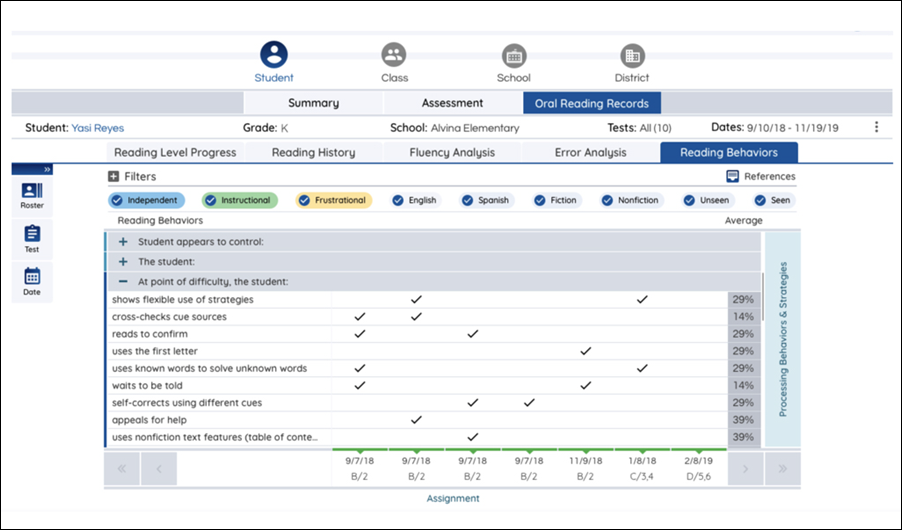
View a student’s Reading Behaviors report by selecting the Reading Behaviors tab. The data in this graph comes from your evaluation in the Processing Behaviors and Strategies section on the Analysis step of an Oral Reading Record.
|
|
Since Fluency is an optional step when conducting an Oral Reading Record, there may not be a report to display. If there is no rubric data for any students, you will see a message that says “No Fluency Analysis Tracked”. Try marking some Fluency and Accuracy categories on the Analysis step when marking an Oral Reading Record. (see Analyze a Student’s Record) |
- Each checkmark shows a behavior exhibited in a particular record.
- Reading Behavior categories are listed in the grey headers of the chart. These categories can be collapsed or expanded.
- Each category contains various descriptions of student behaviors. Hover over long truncated descriptions to read the full text.
- The far-right column of the chart shows the Average percentage of times a Reading Behavior is displayed in a student’s records. Hover over the percentage to see the Average in Fraction form (number of times the behavior was exhibited over the number of records taken).
- The categories and behaviors vary by the reading level of the text. Therefore, if the behavior could only be evaluated for one text the student read, and they exhibited the behavior, the average will show as 100%.
- The X axis shows the different records a student has taken from oldest to most recent. The following is displayed for each record:
- Date the record was taken
- The Reading Level of the record
- The Proficiency score the student achieved as displayed by the color (Independent - blue, Instructional - green, or Frustrational - yellow).
- Hovering over each record displays the record’s name.
- Use the blue navigation arrows on the bottom corners of the Fluency Analysis report to view data for assignments taken on other dates. The single arrow will show you other assignments by changing the columns one at a time. The double arrow will skip all the way to the first or last column.